If you’re like me, you find three-day weekends to be bittersweet.
On the one hand you get that extra day of rest but often spend that extra day wishing we were trading.
Like so many weeks during the liquidity-fueled, post-Covid crisis bull market environment we’ve all been fortunate enough to trade in, this past week offered a bounty of bullish opportunities.
When we consider that small caps, as measured by the IShares Russell 2000 ETF (IWM) outpaced the benchmark SPDR S&P 500 ETF (SPY), some of the best opportunities were in smallcap land.
The best things in life are free
Believe it or not, retail investors with access to the internet have coverage to some amazingly informative data that doesn’t cost a dime.
Today I’m going to walk you through what those are, and how you can implement them to become a better decision maker and trader.
That’s right, accessible government sources like the Commodity Futures Trading Commission’s website (https://www.cftc.gov/) and the Federal Reserve Bank of St. Louis’ website (https://fred.stlouisfed.org/) offer an enormous amount of information that institutional traders use.
The key, of course, is knowing how to use the data.
In the future, I will make it a point to introduce you to some of this information whenever it helps tell a story about a market narrative that may be playing out.
For today, I’d like to start by introducing you to the CFTC’s (Commodity Futures Trading Commission) Commitments of Traders report.
The CFTC’s Commitments of Traders report is an excellent free resource
Sentiment plays a critical role in determining when market cycles may have reached extremes.
Some of the best indicators are built with the information provided in the CFTC’s weekly Commitments of Traders report when it comes to sentiment indicators.
Each Friday, holiday schedule permitting, the CFTC releases this information at 3:30 p.m. Eastern time. Each Friday’s report contains data that is gathered the preceding Tuesday, so there is a bit of a lag in the reporting.
Since this information is used to find big turning points, however, the lag usually isn’t a problem.
In any event, the information contained in the report can be used to help guide traders to areas of the market where large moves may be about to occur due to an adjustment in sentiment
Hedge funds had a sizeable short position in small caps heading into this week
You can find a full explanation of the CFTC’s methodology in gathering and reporting this information by visiting this link: https://www.cftc.gov/MarketReports/CommitmentsofTraders/index.htm
For today, though, I’m excited to give you a quick overview and show you how you could have used this report to identify that, coming into this week, hedge funds were carrying a large short position in smallcaps, thereby increasing the potential for outsized, squeeze-fueled setups.
The Friday CoT report measures the long vs. short futures positioning of three different groups of traders in its simplest form.
First, the Large Speculators can be thought of as hedge funds and CTAs (Commodity Trading Advisors). This category of traders is viewed as trend followers.
Next, there are the Small Speculators, folks like you and me (i.e., retail traders). This group is also viewed as trend followers.
Lastly, there are Commercial Hedgers. These traders are Swap Dealers and producers that may be producing a commodity and are in the market to hedge their costs. This category is considered to be the “smart money.”
On the chart below, you’ll find an accurate picture of what this data looked like as of the report released before this week’s action on May 21st.
Remember, the CoT report is a weekly report, so everything you see on this chart is weekly increments.
Figure 1
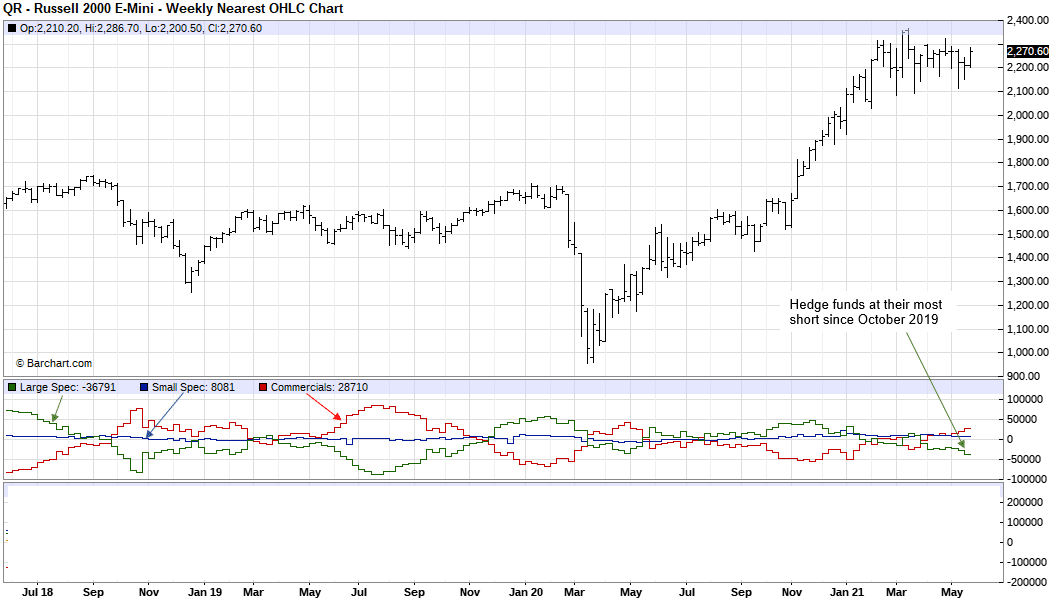
The top panel of the chart shows a weekly bar chart of the Russell 2000 E-mini futures contract.
The bottom panel contains the net positions of the three groups of traders discussed above.
Anything below the zero line on the bottom panel chart means there is a net-short position, while anything above means there is a net-long position.
If we focus on the green line, we see that hedge funds have been growing increasingly net short in recent weeks, to the point where they were at their shortest since October 2019 heading to this week.
Like any sentiment indicator, this information is used as an early indication that traders are starting to get positioned too heavily to one side.
From there, a trader waits for confirmation from price that this crowded trade is in the process of being reversed.
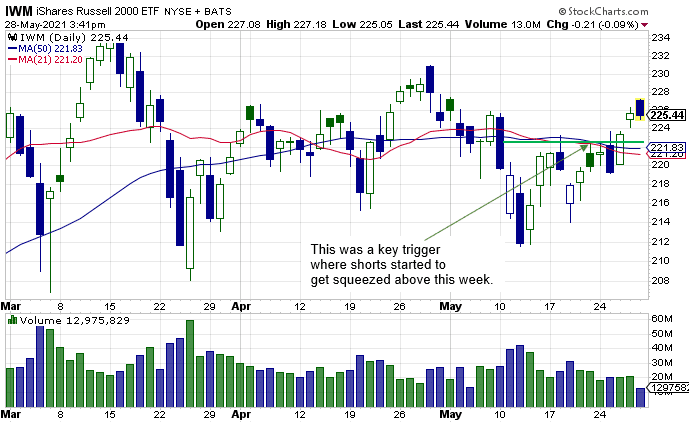
As the next chart shows, that reversal signal came this past week, when IWM pushed back above the most recent pivot high of the preceding downtrend.
Figure 2
Take your time implementing these resources. Information overkill can lead to indecisiveness. However, that shouldn’t detract you from knowing what others do.
0 Comments